Simplified Data Leads to Valuable Decisions.
Whether you are a CEO, CFO, Surgeon or a Clinical Chief of Staff we’ve got reports that will give you the insights you need to communicate effectively with your team and make impactful decisions.
Exportable Reports
Macro and Micro Views
Here are just a few of our most popular reports and a brief description of how MedBen Analytics clients are using them to transform their hospital:
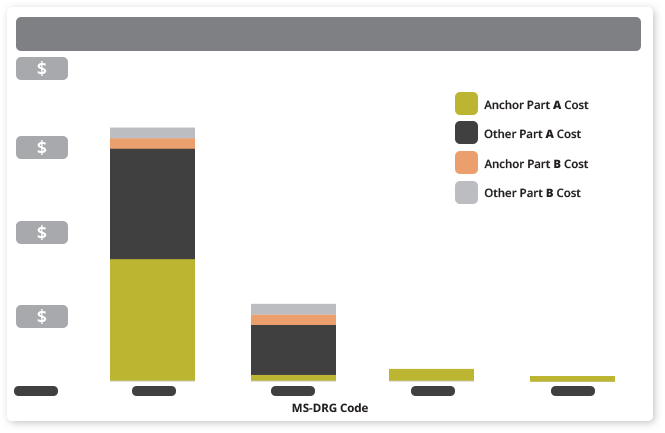
Readmissions by MS-DRG
Used By: Decision Support, Physicians, and Nurses
How They Use It:
To discuss clinical policy and quality metrics which leads to improved patient outcomes.
The volume, cost, and timing of readmissions for a specific MS-DRG tells the clinical team where there is room for improvement and patient follow up. Clinical metrics and goals for readmission rates can be set and measured using this report.
- See how many episodes have had a readmission as well as the total number of readmissions.
- See readmission costs incurred at the Anchor Facility versus outside facilities.
- See readmission costs paid under Part A and Part B.
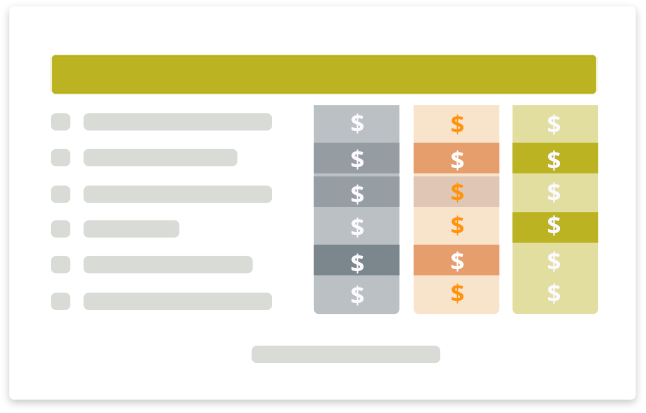
Summary Report – Cost Type Averages
Used By: CEO, CFO, COO, Clinical Staff
How They Use It:
To see the broad view of performance for one facility or multiple facilities within a system. See how their facility stacks up to others within their system or against the region they sit in.
- See average episode cost by facility.
- See average cost breakdown by category including Anchor Admission, Skilled Nursing, OutPatient, DME, Readmission, Rehab, LTAC, and Home Health.
- Click on a facility to see cost breakdown by episode to identify outliers.
- Compare the average episode cost to the Target Price and the Region Average to set goals and measure performance at the facility and system level.


Risk Track Display Report
Used By: Executive Leadership and Decision Support
How They Use It:
Quickly identify episodes that have been trimmed to limit risk at the episode level under the model. Identifying the cost adjusted cases is the first step to performing a clinical case study and deep dive into the data. Click on an episode within the report and drill down into the exact costs and diagnosis codes that were attributed to the outlier.
- See anchor begin date, anchor end date, and episode end date.
- See unadjusted episode cost (actual spend before risk adjustment), adjusted episode cost (risk adjusted cost that is used to calculate NPRA), and the amount trimmed off of the episode.
- See and measure performance of the episode cost as compared to the target price, region average, and risk trim point.
- Drill down to the claim level on high risk episodes to see every last detail.
Risk Tracks Display – Drill Down to Details Report
Used By: Clinical Staff and Decision Support
How They Use It:
To see episode details that are truly impacting their clinical performance, patient outcomes, and negatively impacting their Net Payment Reconciliation Amount (NPRA).
- See episode data at the claim level.
- Drill down to the claim expense line level on high risk episodes to see every detail billed on each claim. The billed amount, amount paid by CMS, amount attributed to the episode, CPT/HCPCS/Revenue codes, the diagnosis codes, and place of service.
NPRA (Summary by Physician)
Used By: Physicians, Chief of Staff
How They Use It:
This NPRA report calculates the individual financial performance for each physician in each MS-DRG and fracture status. A physicians individual financial performance can be indicative of outstanding practice patterns and decision making or show the opportunity to open discussions and find improvements or inefficiencies.
- See the percent of episodes attributed to each physician
- See the NPRA calculated left to right for each physician
- See the financial contribution or reduction to the aggregate NPRA for each anchor physician
NPRA (Net Payment Reconciliation Amount)
Used By: C-Suite (CEO, CFO, COO, Clinical Chief of Staff), Physicians
How They Use It:
To see how much they owe CMS or preferably how much CMS owes them. This is our most popular report as it shows the financial impact. This report can be ran each time files are retrieved (monthly) so that there are no surprises at the point of a scheduled CMS Reconciliation.
- See target price, number of episodes, standardized period target amount, standardized period adjusted, or trimmed, payments.
- Adjustments for wage factor which move the cost from standardized dollars to real dollars.
- Net Payment amounts before the NPRA cap (actual earn) and after the NPRA Cap is applied to see final NPRA.
Explore our other services
Data Insights
We break down insights from surgeon performance to post-acute care, performance and readmission rates, and other categories.
Action Plan
What’s your next step once you understand what the data means? We’ll help you weigh the options and create a plan.
Measurement
How well is your plan working? We can help you compare your past and present results – from efficiencies to profits – and strategize for the future.